Austins Oldest Profession: Texas Top Lobby Clients & Those Who Service Them
2002 Edition
II. Lobby Clients
A. Texas Escalating Lobby Spending
| [ Austins Oldest Profession: Texas Top Lobby Clients & Those Who Service Them 2002 Edition II. Lobby ClientsA. Texas Escalating Lobby Spending |
|
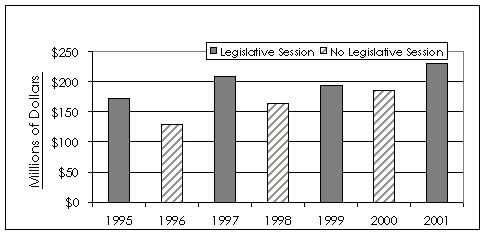
This report exposes the industries and clients that spent the most to influence public officials in 2001 and Texas top hired-gun lobbyists that year. Lobbying is a growth industry, as the Texas Ethics Commission data graphed below reveal. Special interests spent up to $230 million on Texas lobbyists in 2001, up 33 percent from the up to $172 million that lobby clients spent in 1995. (The exact values of lobby contracts are not known because Texas lobbyists report these values in ranges, such as $50,000 to $99,999). Over the past seven years, special interests have spent between $552 million and $1.3 billion on 40,735 Texas lobby contracts. As the table below shows, lobby spending has ballooned even though the total number of lobbyists, clients and contracts has stayed relatively constant.Texas lobby spending peaks in odd-numbered years when the biennial Texas Legislature is in session. With the exception of 1999, lobby spending has increased over time, regardless of whether you compare legislative years (striped bars) or years when the legislature did not meet (solid bars). Lobby spending for a given year peaks at the end of the year after the last lobby reports are filed. The data on this page reflect year-end data for each year shown. These data differ from the data used in the rest of this report, which reflect lobby contracts reported as of Julyafter the 2001 legislative session adjourned. The reason for this discrepancy is that year-end data were not available when research on this report began in late 2001.
Texas Escalating Lobby Spending (95-01) Note: Chart data show maximum value of year-end lobby contracts.
Max. Value Min. Value No. of No. of No. of Year of Contracts of Contracts Contracts Lobbyists Clients 1995 5,730 1,687 2,100 1996 4,490 1,374 1,657 1997 6,526 1,662 2,303 1998 5,495 1,410 1,882 1999 6,280 1,635 2,278 2000 5,834 1,393 2,058 2001 6,391 1,600 2,127 TOTAL 40,746 * *
*Grand totals for these categories would be misleading since many lobbyists and clients keep reappearing throughout the seven-year period covered