Austins Oldest Profession: Texas Top Lobby Clients & Those Who Service Them
2002 Edition
II. Lobby Clients
D. Clients By Interest Category
| [ Austins Oldest Profession: Texas Top Lobby Clients & Those Who Service Them 2002 Edition II. Lobby ClientsD. Clients By Interest Category |
|
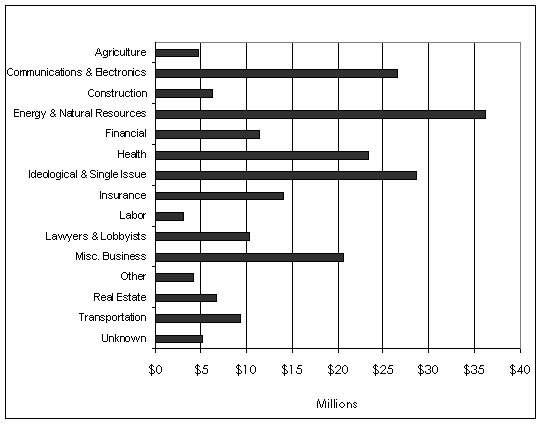
This report categorizes Texas 2001 lobby contracts by their underlying interests. Energy & Natural Resources is the leading category, accounting for 17 percent of all the money spent on lobby contracts in Texas. The next largest categories, respectively, are Ideological & Single-Issue clients (13 percent), Communications & Electronics clients (13 percent), Health clients (11 percent) and Miscellaneous Business clients (10 percent).
 |
||||||||||||||||||||||||||||||||||||||||||||||||||||||||||||||||||||||||||||||||||||||||||
|
![]()
![]()