|
 |
||||||||||
I. Total Texas PAC Spending
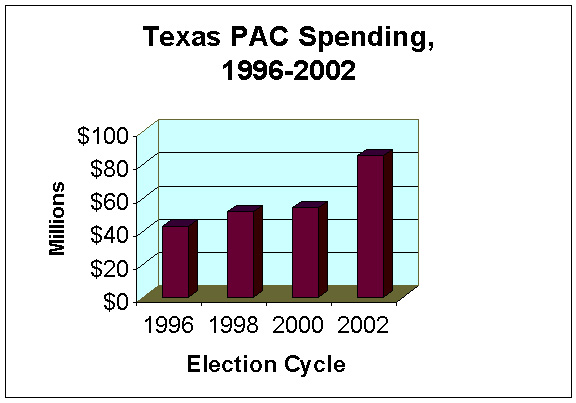
This report identifies and ranks Texas top general-purpose political action committees (PACs) in the 2002 election cycle. These rankings are based on the total amount of expenditures that PACs electronically reported to the Texas Ethics Commission.1 During the two-year election cycle ending in December 2002, 964 general-purpose PACs reported spending a total of $85.3 million.2
Texas PAC spending almost doubled from
$43 million in the 1996 cycle to more than $85 million in the 2002 cycle.
The greatest growth spurt (58 percent) occurred from 2000 to 2002.
| Election
Cycle |
No. of
Active PACs |
PAC
Spending |
Spending
Increase
From Previous Cycle |
Spending
Increase (%) |
| 1996 | 911 | $43,082,546 | NA | NA |
| 1998 | 893 | $51,543,820 | $8,461,274 | 20% |
| 2000 | 865 | $53,996,975 | $2,453,155 | 05% |
| 2002 | 964 | $85,320,226 | $31,323,251 | 58% |
2 While the largest PAC expenditures typically take the form of contributions to candidates or other PACs, PACs also spend money on overhead and other expensesall of which are included here.