|
 |
||||||||||
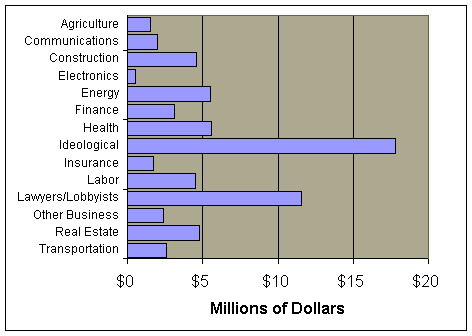
As discussed above, Business PACs accounted
for two-thirds of all 2004 PAC spendingdespite the fact that Business
PACs cumulatively spent 4 percent less than they had in 2002. Indeed, just
four out of 12 Business subsectors increased PAC spending from 2002 to
2004, with Lawyers and Lobbyists PACs boosting their spending by a comparatively
modest 3 percent over this period. This leaves three fast-growth industries
that increased their spending more than 15 percent each: Communications,
Health and Real Estate.
| Interest Category | No. of
Active 2004 PACs |
2004 PAC
Spending |
Share
of '04 Spending |
Spending
Change From '02 (%) |
| Agriculture | 27 | $1,504,376 | 2% | -18% |
| Communications | 20 | $2,026,617 | 3% | 17% |
| Construction | 69 | $4,615,275 | 7% | -2% |
| Electronics | 6 | $466,169 | 1% | -15% |
| Energy/Natural Resources | 54 | $5,539,115 | 8% | -28% |
| Finance | 38 | $3,167,020 | 5% | -16% |
| Health | 52 | $5,656,252 | 8% | 17% |
| Ideological | 278 | $17,789,167 | 26% | -47% |
| Insurance | 21 | $1,710,183 | 2% | -15% |
| Labor | 79 | $4,512,391 | 7% | 19% |
| Lawyers/Lobbyists | 44 | $11,487,862 | 17% | 3% |
| Miscellaneous Business | 48 | $2,432,734 | 4% | -6% |
| Real Estate | 33 | $4,801,603 | 7% | 16% |
| Transportation | 24 | $2,680,931 | 4% | -10% |
| Unknown | 57 | $514,829 | 1% | - |
| TOTAL: | 850 | $68,904,524 | 100% | 19% |
| PAC | 2004
Cycle Spending |
2004
PAC Rank |
2002
PAC Rank |
'02-'04
Spending Change |
| SBC Texas | $1,167,318 | 10 | 15 | 56% |
| Time Warner Cable | $338,015 | 41 | 87 | 91% |
| Grande Communications | $212,950 | 69 | 210 | 287% |
| Verizon Communications | $100,203 | 140 | 62 | -55% |
| AT&T | $93,856 | 149 | 88 | -47% |
| MCI Employees | $91,825 | 151 | 160 | 12% |
| Valor TELPAC | $56,133 | 225 | 230 | -13% |
Communications PACs increased their spending 17 percent from 2002 to 2004. Leading this industry were rivals SBC and Time Warner Cable, which faced off in one of the top business showdowns of 2005. SBC suffered a rare defeat during the regular legislative session, when it fumbled a Texas two step. The phone giant sought to deregulate what it can charge for the local phone monopoly that it controls throughout much of the state, even as it demanded entry into television marketswithout paying the local franchise taxes paid by the cable industry. After this scheme died, Governor Perry convened a special session--ostensibly to tackle school finances. Failing this objective, lawmakers approved the SBC giveaway instead.
Although SBCs $1.2 million in PAC
expenditures were almost four times that of its rival, Time Warners PAC
dug deep, increasing its spending 91 percent from 2002 to 2004. Internet,
phone and cable provider Grande Communications clocked even faster growth,
jacking up its PAC spending 287 percent. In contrast, PAC spending by the
states other local phone giant, Verizon, fell 55 percent.
| PAC | 2004
Cycle Spending |
2004
PAC Rank |
2002
PAC Rank |
'02-'04
Spending Change |
| TX Medical Assn | $1,919,026 | 5 | 7 | 15% |
| TX Optometric PAC | $598,844 | 18 | 30 | 220% |
| TX Dental PAC | $593,590 | 19 | 20 | -3% |
| TX Hospital Assn | $239,932 | 62 | 52 | -8% |
| TX Society of Anesthesiologists | $181,095 | 80 | 95 | 13% |
| TX Podiatric Medical PAC | $177,618 | 82 | 238 | 281% |
| TX Opthalmological Assn | $175,763 | 85 | 114 | 37% |
Health industry PACs increased their
spending 17 percent from 2002 to 2004, led by the $1.9 million that the
Texas Medical Association spent. Doctors, hospitals and nursing homes led
the charge to pass Proposition 12, the 2003 constitutional amendment that
allowed lawmakers to cap damages that juries award in medical malpractice
cases. Optometrists, the non-medical doctors who prescribe corrective lenses,
continued their turf battles with medical-doctor opthalmologists in 2005.5
Optometrists notably want a piece of the pricey market for LASIK surgery
that can render their lenses obsolete. The Texas Dental PAC continued its
turf battles with dental hygienists in the 2005 session while dodging proposals
to expand taxes on professionals. The Texas Podiatric Medical PAC has waged
a long regulatory game of footsy against orthopedists over how far up the
ankle a podiatrist may venture.
| PAC | 2004
Cycle Spending |
2004
PAC Rank |
2002
PAC Rank |
'02-'04
Spending Change |
| TX Assn of Realtors (TAR) | $2,967,081 | 2 | 5 | 38% |
| TX Apartment Assn | $324,000 | 43 | 40 | 12% |
| Houston Apartment Assn | $268,608 | 54 | 54 | 5% |
| Tarrant Co. Apartment Assn | $154,452 | 99 | 301 | 327% |
| TAR Issues Mobilization PAC | $131,173 | 115 | 196 | 119% |
| Gr. Dallas Apartment Assn | $120,416 | 126 | 108 | -12% |
| Houston Realty Breakfast Club | $120,378 | 127 | 166 | 52% |
Real Estate PACs pushed spending up 16 percent in 2004, led by the Texas Association of Realtors. Realtors won two big battles in 2005. First, they fended off proposals to increase educational funding through taxes on real estate sales. Second, they got the state to crack down on no-frills competitors, who charge home sellers a fraction of the 6 percent commission commanded by full-service agents. Foiling discount agentswho typically just list and advertise homesthe 2005 legislature required agents to represent homeowners in negotiations with buyerseven if the seller does not want this service. State and local chapters of the Texas Apartment Association constitute another PAC powerhouse. Apartment owners, who can face liabilities for assaults and other injuries on their premises, applauded the 2003 passage of Proposition 12 to allow lawmakers to cap legal damages.